PEPE Price Prediction: Is It a Good Investment Amid Market Volatility?

#PEPE
- Technical Indicators: PEPE is trading below its 20-day MA, with neutral MACD and Bollinger Bands hinting at possible volatility.
- Market Sentiment: Mixed due to smart money accumulation offset by technical glitches and price drops.
- Investment Outlook: Cautiously optimistic, with potential for rebound if key support levels hold.
PEPE Price Prediction
PEPE Technical Analysis: Key Indicators to Watch
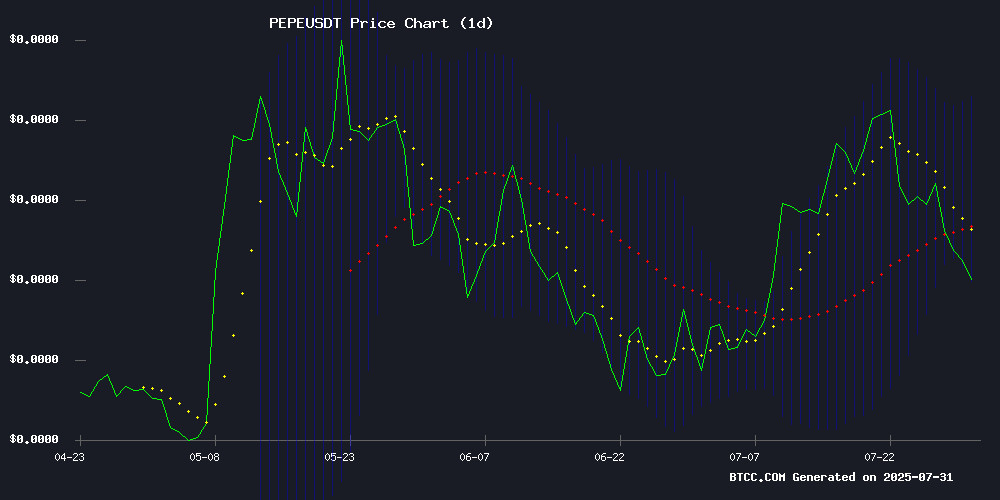
According to BTCC financial analyst Emma, Pepe is currently trading at 0.00001157 USDT, below its 20-day moving average (MA) of 0.00001272. The MACD indicator shows a neutral signal with a histogram at 0.00000000, while the signal line is at -0.00000084 and the MACD line at 0.00000085. The Bollinger Bands suggest potential volatility, with the upper band at 0.00001437, middle band at 0.00001272, and lower band at 0.00001107. Emma notes that the price is hovering near the lower Bollinger Band, which could indicate a potential rebound if buying pressure increases.
Market Sentiment Mixed as PEPE Shows Resilience Amid Challenges
BTCC financial analyst Emma highlights that while PEPE has shown resilience with smart money accumulation, recent news of Hyperliquid API outages and a 6% price drop has created mixed sentiment. Emma suggests that the current technical signals align with a cautious outlook, but accumulation by informed investors could signal underlying strength.
Factors Influencing PEPE’s Price
PEPE Price Shows Resilience as Smart Money Accumulates Despite Market Decline
PEPE demonstrates notable stability in turbulent market conditions, declining just 4% compared to the broader cryptocurrency market's 5.7% drop. The meme coin's relative strength highlights growing investor confidence, particularly among sophisticated traders.
Smart money accumulation has emerged as the key driver, with institutional-level interest pushing analysts to set bullish targets between $0.000015 and $0.000016. Trading volumes remain healthy at $158.9 million, while the RSI at 44.91 suggests potential for momentum reversal.
The coin's resilience during recent market selloffs indicates stronger support levels than typical meme tokens. This shift from retail-driven speculation to strategic accumulation marks a significant evolution in PEPE's market profile.
Hyperliquid API Outage Leaves Traders Stranded During Critical Market Shift
Hyperliquid's decentralized exchange suffered a 27-minute API failure on July 29, freezing all trading activity during a pivotal market reversal. The outage, occurring between 14:20 and 14:47 UTC, blocked access to positions, stop-loss orders, and account management—despite the chain continuing to produce blocks.
The disruption coincided with abnormal funding rate activity and left traders like James Wynn exposed, with his PEPE long position undergoing partial liquidations during the blackout. Market participants raised concerns about platform stability as the outage overlapped with a volatile crypto trend reversal, sparking theories ranging from systemic flaws to coordinated attacks.
PEPE Price Drops 6% Amid Mixed Technical Signals
PEPE's price fell sharply by 6% to $0.00, with technical indicators presenting conflicting signals. The Relative Strength Index (RSI) at 41.41 suggests neutral conditions, while MACD indicators point to bearish momentum. Trading volume remains robust at $151 million on Binance, indicating sustained interest despite the downturn.
No major news catalysts are driving the current price action, leaving PEPE vulnerable to technical selling pressure. Bollinger Bands show the asset nearing lower support levels, potentially creating a buying opportunity for traders anticipating a rebound.
Is PEPE a good investment?
According to BTCC analyst Emma, PEPE presents a mixed investment case. Below is a summary of key technical and sentiment factors:
| Indicator | Value | Implication |
|---|---|---|
| Current Price | 0.00001157 USDT | Below 20-day MA, potential undervaluation |
| MACD | Neutral (0.00000000) | No strong momentum signal |
| Bollinger Bands | Near lower band (0.00001107) | Possible rebound zone |
| Market News | Smart money accumulation vs. API outages | Mixed sentiment |
Emma advises caution but notes that accumulation by savvy investors could indicate long-term potential.
